The diagram below shows two budget deficit functions for a hypothetical economy. 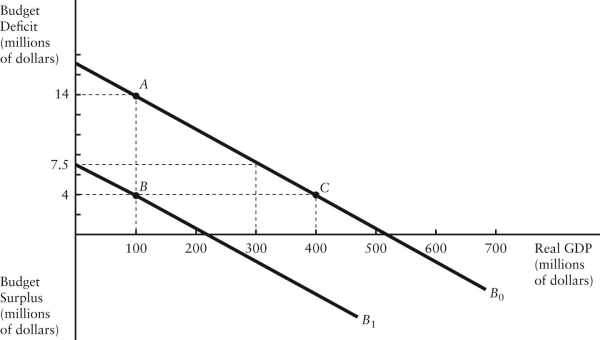 FIGURE 31-2
-Refer to Figure 31-2.Initially,suppose the economy is at point A on budget deficit function  .Real GDP (Y) is $100 million.If the level of potential output (Y*) were $300 million,the structural budget deficit would be
A) $4 million.
B) $6.5 million.
C) $7.5 million.
D) $14 million.
E) Insufficient information to know.
Correct Answer:
Verified
Q62: The best measure of the change in
Q64: Suppose the change in the government's debt-to-GDP
Q65: Consider changes in the government's debt-to-GDP ratio.Suppose
Q66: If the economy goes into a recession,the
Q68: The diagram below shows two budget deficit
Q72: Suppose the government's actual budget deficit is
Q72: The diagram below shows two budget deficit
Q73: The data below provides the Actual and
Q77: The government's structural budget deficit is the
Q80: Consider the following variables,defined as follows: d
Unlock this Answer For Free Now!
View this answer and more for free by performing one of the following actions

Scan the QR code to install the App and get 2 free unlocks

Unlock quizzes for free by uploading documents