The diagram below shows two budget deficit functions for a hypothetical economy. 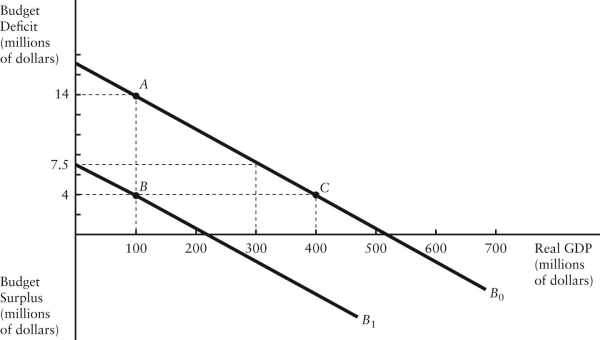 FIGURE 31-2
-Refer to Figure 31-2.Initially,suppose the economy is at point A on budget deficit function  .Real GDP (Y) is $100 million.If the level of potential output (Y*) were $300 million,how much of the actual budget deficit is due to the underlying structure of fiscal policy and is therefore independent of the current level of GDP?
A) $4 million.
B) $6.5 million.
C) $7.5 million.
D) $14 million.
E) Insufficient information to know.
Correct Answer:
Verified
Q61: Consider a government with a positive stock
Q62: The best measure of the change in
Q73: Suppose the real interest rate on government
Q73: The data below provides the Actual and
Q75: Suppose the change in the government's debt-to-GDP
Q77: The data below provides the Actual and
Q79: The data below provides the Actual and
Q80: The diagram below shows two budget deficit
Q81: Consider the following data about government debt
Q89: The concept of "national saving" refers to
Unlock this Answer For Free Now!
View this answer and more for free by performing one of the following actions

Scan the QR code to install the App and get 2 free unlocks

Unlock quizzes for free by uploading documents