The data below provides the Actual and Structural Budget Deficits,as a percentage of real GDP,for Canada between 1999 and 2010.Note that a negative value in the table indicates a budget surplus.
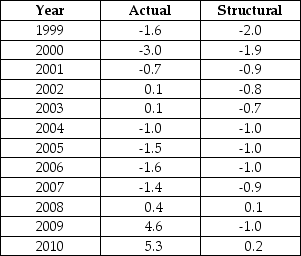 TABLE 31-2
-Refer to Table 31-2.Consider the year 2004.Based on the data in the table we can conclude that
A) fiscal policy was expansionary in that year.
B) real output was less than potential in that year.
C) real output was equal to potential in that year.
D) real output was greater than potential in that year.
E) monetary policy was expansionary in that year.
Correct Answer:
Verified
Q57: The diagram below shows the budget deficit
Q58: The diagram below shows the budget deficit
Q59: The diagram below shows two budget deficit
Q60: Consider the government's budget deficit function,graphed with
Q64: Suppose the change in the government's debt-to-GDP
Q65: Consider changes in the government's debt-to-GDP ratio.Suppose
Q66: If the economy goes into a recession,the
Q76: The government's structural budget deficit adjusts for
A)any
Q78: Consider a government with a positive stock
Q80: Consider the following variables,defined as follows: d
Unlock this Answer For Free Now!
View this answer and more for free by performing one of the following actions

Scan the QR code to install the App and get 2 free unlocks

Unlock quizzes for free by uploading documents