The following diagrams show the production possibilities boundaries for Austria and Switzerland,for the production of bicycles and shoes. 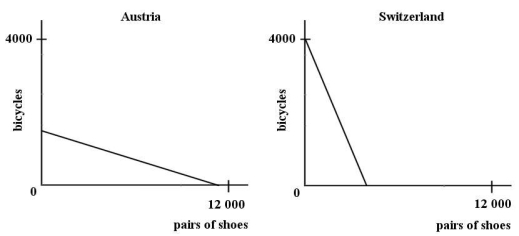 FIGURE 32-2
-Refer to Figure 32-2.The diagrams illustrate that the ________ is lower in Austria than in Switzerland.
A) opportunity cost of producing shoes
B) opportunity cost of producing bicycles
C) total cost of producing shoes
D) average cost of producing bicycles
E) comparative advantage in producing bicycles
Correct Answer:
Verified
Q15: Suppose Canada could produce all goods and
Q16: Suppose Spain is currently producing 90 units
Q27: The following diagrams show the production possibilities
Q28: If two countries each produce wool and
Q29: The following diagrams show the production possibilities
Q31: When opportunity costs differ between countries,
A)comparative advantages
Q33: Ireland and Japan are assumed to produce
Q34: Ireland and Japan are assumed to produce
Q36: Ireland and Japan are assumed to produce
Q37: Ireland and Japan are assumed to produce
Unlock this Answer For Free Now!
View this answer and more for free by performing one of the following actions

Scan the QR code to install the App and get 2 free unlocks

Unlock quizzes for free by uploading documents