The diagram below shows Robinson Crusoe's annual production possibilities boundary for the production of bananas and coconuts. 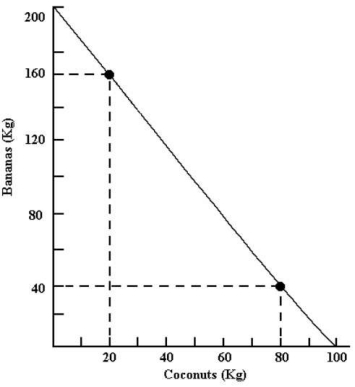 FIGURE 32-3
-Refer to Figure 32-3.Starting from point A and moving to point B,Robinson Crusoe's opportunity cost of producing each additional kilogram of coconuts is
A) increasing.
B) increasing followed by decreasing.
C) constant.
D) decreasing.
E) decreasing followed by increasing.
Correct Answer:
Verified
Q62: When two countries are specializing and trading
Q69: When specialization according to comparative advantage also
Q76: The diagram below shows Robinson Crusoe's annual
Q77: The diagram below shows Robinson Crusoe's annual
Q78: This table shows how much cotton and
Q81: Consider the trade of a product between
Q82: The diagram below shows the domestic demand
Q84: The diagram below shows the domestic demand
Q85: The diagram below shows the (hypothetical)demand and
Q89: The theory that patterns of international trade
Unlock this Answer For Free Now!
View this answer and more for free by performing one of the following actions

Scan the QR code to install the App and get 2 free unlocks

Unlock quizzes for free by uploading documents