The Figure Below Shows Arcticland's Annual Production Possibilities Boundary for the Production
The figure below shows Arcticland's annual production possibilities boundary for the production of fish and ice. 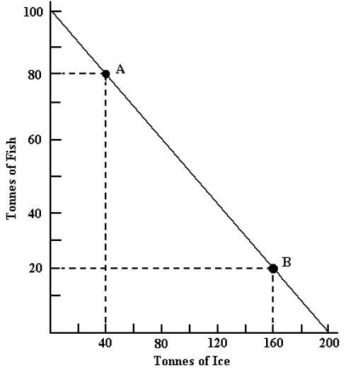 FIGURE 32-4
-Refer to Figure 32-4.Beginning at point A on Arcticland's production possibilities boundary,the opportunity cost of producing 10 more tonnes of fish is ________ and the opportunity cost of producing 10 more tonnes of ice is ________.
A) 5 tonnes of fish; 20 tonnes of ice
B) 5 tonnes of ice; 20 tonnes of fish
C) 20 tonnes of ice; 5 tonnes of fish
D) 10 tonnes of ice; 10 tonnes of fish
E) 0; 0
Correct Answer:
Verified
Q65: This table shows how much wine and
Q67: This table shows how much wine and
Q70: According to David Ricardo's principle of comparative
Q71: This table shows how much wine and
Q72: The figure below shows Arcticland's annual production
Q81: International trade permits a country to
A)produce and
Q84: A country with a _ domestic market
Q92: Consider the sources of the gains from
Q96: North America exports clothing to the European
Q97: Consider the sources of the gains from
Unlock this Answer For Free Now!
View this answer and more for free by performing one of the following actions

Scan the QR code to install the App and get 2 free unlocks

Unlock quizzes for free by uploading documents