The diagram below shows the demand and supply curves for refrigerators in Canada. 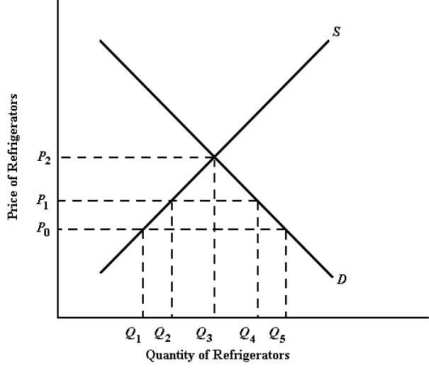 FIGURE 33-1
-Refer to Figure 33-1.At the price P0,the quantity of refrigerators supplied to the Canadian market by domestic Canadian producers is
A) Q1.
B) Q2.
C) Q3.
D) Q4.
E) Q5.
Correct Answer:
Verified
Q39: If a country is exporting more goods
Q40: Assume Canada is trading with a country
Q41: The diagram below shows the demand and
Q42: The diagram below shows the demand and
Q45: If a country is small in world
Q46: The diagram below shows the demand and
Q48: If Canada reduces the tariff imposed on
Q48: The diagram below shows the domestic demand
Q49: The diagram below shows the domestic demand
Q54: Suppose a 10% tariff on all wines
Unlock this Answer For Free Now!
View this answer and more for free by performing one of the following actions

Scan the QR code to install the App and get 2 free unlocks

Unlock quizzes for free by uploading documents