The table below shows indexes for the price levels for Canada and the United States and the nominal exchange rate between their currencies (the Canadian-dollar price of 1 U.S.dollar) .
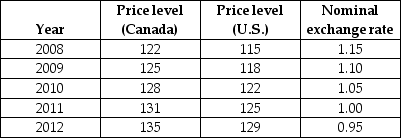 TABLE 34-2
-Refer to Table 34-2.According to the theory of purchasing power parity (PPP) ,the Canada-US exchange rate in 2008 should have been
A) 115/122 = 0.94.
B) 1.15,the actual exchange rate that year.
C) (122 × 115) /100 = 140.3.
D) 122,the price level in Canada that year.
E) 122/115 = 1.06.
Correct Answer:
Verified
Q121: If a basket of goods costs $1000
Q124: If a basket of goods costs 1000
Q133: If a basket of goods costs 1000
Q142: In Canada,proponents of a flexible exchange rate
Unlock this Answer For Free Now!
View this answer and more for free by performing one of the following actions

Scan the QR code to install the App and get 2 free unlocks

Unlock quizzes for free by uploading documents