Figure: 13-5a 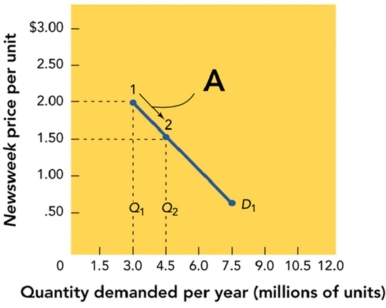
-Figure 13-5a shows that when the price moves from $2.00 to $1.50 per unit,the quantity demanded
A) increases from 3.0 to 4.5 million units per year.
B) decreases from 4.5 to 3.0 million units per year.
C) stays the same.
D) increases from 3.0 to 7.5 million units per year.
Correct Answer:
Verified
Q122: A break-even point is:
A)the point of greatest
Q123: Figure: 13-5a Q124: The Precision Writing Instruments Company makes two Q125: Tim Marlow,the owner of The Clock Works,wanted Q126: You have been asked to calculate the Q128: Ace Shoe Company sells heel replacement kits Q129: Which of the following would be an Q130: Ace Shoe Company sells heel replacement kits Q131: Which of the following would be an Q132: The owner of a small restaurant that![]()
Unlock this Answer For Free Now!
View this answer and more for free by performing one of the following actions

Scan the QR code to install the App and get 2 free unlocks

Unlock quizzes for free by uploading documents