Figure: 13-5b 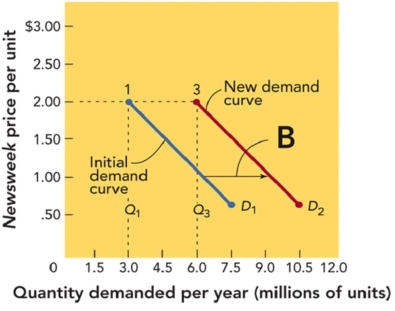
-In Figure 13-5b,as the two diagonal lines on a demand curve graph show a shift from left to right,it most likely represents
A) an increase in demand that did not require an increase in price.
B) an increase in demand that required an increase in price.
C) no change in price and no change in demand.
D) no change in demand or price but a greater profit due to economies of scale.
Correct Answer:
Verified
Q137: When Coca-Cola considers their variable production costs,fixed
Q138: Break-even analysis is:
A)a process that investigates the
Q139: The owner of a small restaurant that
Q140: Ace Shoe Company sells heel replacement kits
Q141: The manufacturer of a Blu-Ray-R,a recordable Blu-Ray
Q143: Hallmark was the official supplier of flowers
Q144: Ace Shoe Company sells heel replacement kits
Q145: Which product is likely to experience skimming
Q146: Because the guitars made by Washburn Guitars
Q147: The theory behind freemium pricing is that:
A)customers
Unlock this Answer For Free Now!
View this answer and more for free by performing one of the following actions

Scan the QR code to install the App and get 2 free unlocks

Unlock quizzes for free by uploading documents