Multiple Choice
The following graph is a ________. 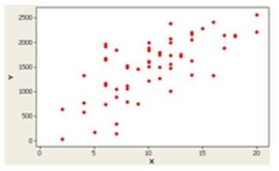
A) dot plot
B) stem-and-leaf display
C) box plot
D) scatter diagram
Correct Answer:
Verified
Related Questions
Q49: The following table is a _.
Q50: The range of the coefficient of skewness
Q51: A sample of experienced typists revealed that
Q52: Using the following statistics to describe a
Q53: The median of a sample will always
Q55: Outliers are clearly presented in a _.
A)dot
Unlock this Answer For Free Now!
View this answer and more for free by performing one of the following actions

Scan the QR code to install the App and get 2 free unlocks

Unlock quizzes for free by uploading documents