The following graph illustrates ________. 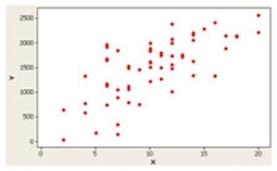
A) a positive or direct relationship
B) a negative or inverse relationship
C) no relationship
D) a distribution for a single variable
Correct Answer:
Verified
Q40: In a stem-and-leaf display,the leaf represents the
Q41: In a scatter diagram,we describe the relationship
Q42: A stem-and-leaf display includes the following row:
Q43: If the coefficient of skewness is equal
Q44: A stem-and-leaf display includes the following row:
Q46: What is the value of the Pearson
Q47: In a contingency table,we describe the relationship
Q48: In the following table, Q49: The following table is a _. Q50: The range of the coefficient of skewness![]()
Unlock this Answer For Free Now!
View this answer and more for free by performing one of the following actions

Scan the QR code to install the App and get 2 free unlocks

Unlock quizzes for free by uploading documents