In the graph at shown,X and Y represent 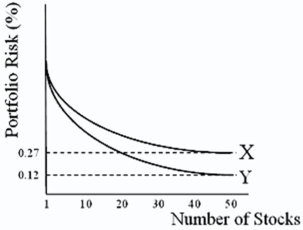
A) U.S.stocks and international stocks.
B) international stocks and U.S.stocks.
C) systematic risk and unsystematic risk.
D) none of the options
Correct Answer:
Verified
Q6: The "world beta" measures the
A)unsystematic risk.
B)sensitivity of
Q7: Foreign equities as a proportion of U.S.investors'
Q8: Systematic risk is
A)non-diversifiable risk.
B)the risk that remains
Q9: A fully diversified U.S.portfolio is about
A)75 percent
Q10: The "Sharpe performance measure" (SHP)is
A)SHP =
Q12: With regard to the OIP,
A)the composition of
Q13: With regard to estimates of "world beta"
Q14: You will get more diversification
A)across industries than
Q15: With regard to the OIP,
A)the composition of
Q16: Systematic risk
A)is also known as non-diversifiable risk.
B)is
Unlock this Answer For Free Now!
View this answer and more for free by performing one of the following actions

Scan the QR code to install the App and get 2 free unlocks

Unlock quizzes for free by uploading documents