In the graph below,X and Y represent 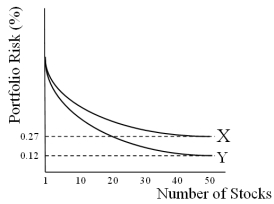
A) U.S.stocks and international stocks.
B) international stocks and U.S.stocks.
C) systematic risk and unsystematic risk.
D) none of the above
Correct Answer:
Verified
Q2: With regard to estimates of "world beta"
Q6: The "world beta" measures the
A)unsystematic risk.
B)sensitivity of
Q7: Under the investment dollar premium system,
A)U.K. residents
Q10: In the context of investments in securities
Q17: Foreign equities as a proportion of U.S.investors'
Q19: Systematic risk
A)is also known as non-diversifiable risk.
B)is
Q20: Studies show that international stock markets tend
Q29: Which of the following is a true
Q39: Compared with bond markets
A)the risk of investing
Q40: Emerald Energy is an oil exploration and
Unlock this Answer For Free Now!
View this answer and more for free by performing one of the following actions

Scan the QR code to install the App and get 2 free unlocks

Unlock quizzes for free by uploading documents