Suppose the figure below shows the demand curve, marginal revenue curve and marginal cost curve for a monopolist. 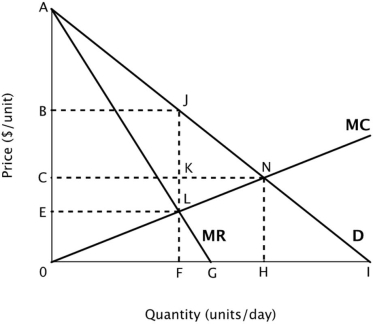 At this monopolist's profit-maximizing level of output, its total revenue equals the area:
A) 0HNC.
B) 0FJB.
C) 0FLE.
D) ELJB.
MC = MR at F units of output, and from the demand curve we can see that at that level of output, the monopolist will charge a price of B. Total revenue equals price times quantity.
Correct Answer:
Verified
Q88: Suppose the table below describes the
Q89: Suppose the figure below shows the demand
Q90: Suppose the figure below shows the demand
Q91: Suppose the table below describes the
Q92: The figure below shows the demand curve,
Q94: Suppose the figure below shows the demand
Q95: Suppose the figure below shows the demand
Q96: Suppose the figure below shows the demand
Q97: Suppose the table below describes the
Q98: Suppose the table below describes the
Unlock this Answer For Free Now!
View this answer and more for free by performing one of the following actions

Scan the QR code to install the App and get 2 free unlocks

Unlock quizzes for free by uploading documents