The figure below depicts the short-run market equilibrium in a perfectly competitive market and the cost curves for a representative firm in that market. Assume that all firms in this market have identical cost curves. 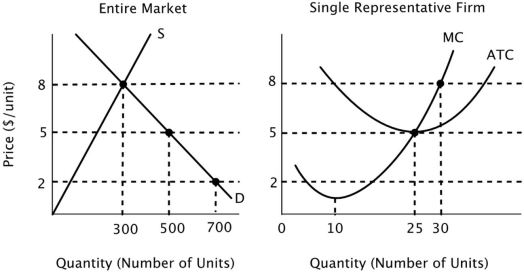 The long-run market equilibrium quantity in this industry is:
A) 300.
B) 500.
C) 700.
D) more than 700.
Correct Answer:
Verified
Q51: Assume that all firms in this industry
Q52: If all firms in a perfectly competitive
Q53: The figure below depicts the short-run market
Q56: Assume that all firms in this industry
Q56: In the long run, in a perfectly
Q57: The figure below depicts the short-run market
Q58: Assume that all firms in this industry
Q60: Assume that all firms in this industry
Q65: Which of the following best describes how
Q66: One assumption of the perfectly competitive model
Unlock this Answer For Free Now!
View this answer and more for free by performing one of the following actions

Scan the QR code to install the App and get 2 free unlocks

Unlock quizzes for free by uploading documents