The figure below shows the supply and demand curves for oranges in Smallville. 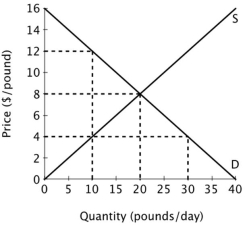 At a price of $4 per pound there will be an excess ______ of ______ pounds of oranges per day.
A) supply; 20
B) demand; 30
C) supply; 10
D) demand; 20
Correct Answer:
Verified
Q107: Which of the following statements best expresses
Q111: The figure below shows the supply and
Q112: The figure below shows the supply and
Q113: The figure below shows the supply and
Q115: Suppose the production of cotton causes substantial
Q117: The figure below shows the supply and
Q119: Suppose the market for coffee is in
Q129: A price ceiling that is set below
Q134: A price ceiling that is set above
Q139: Efficiency is an important goal because when
Unlock this Answer For Free Now!
View this answer and more for free by performing one of the following actions

Scan the QR code to install the App and get 2 free unlocks

Unlock quizzes for free by uploading documents