For a given seller, the figure below shows the relationship between the number of units produced and the opportunity cost of producing an additional unit of output. If the market price of this good is $6, how many units would this seller produce? 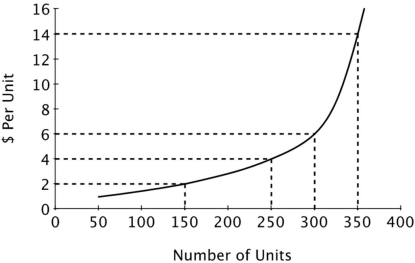
A) 50
B) 150
C) 250
D) 300
Correct Answer:
Verified
Q5: A rational seller will sell another unit
Q7: A seller's supply curve shows the seller's:
A)willingness
Q10: For a single seller, the figure below
Q11: Your neighbors have offered to pay you
Q12: The primary objective of most private firms
Q13: John is trying to decide how
Q14: John is trying to decide how
Q17: John is trying to decide how
Q18: As the market price of a service
Q19: For a given seller, the below above
Unlock this Answer For Free Now!
View this answer and more for free by performing one of the following actions

Scan the QR code to install the App and get 2 free unlocks

Unlock quizzes for free by uploading documents