The following graph depicts demand. 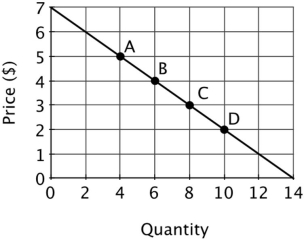 The price elasticity of demand at point C is:
A) 3/16.
B) 16/3.
C) 3/4.
D) 3/8.
Correct Answer:
Verified
Q41: If the quantity demanded of a good
Q43: Demand tends to be _ in the
Q47: The reason a brand name item (e.g.,
Q49: You would expect the price elasticity of
Q50: All else equal, compared to small-budget items
Q51: The following graph depicts demand. 
Q53: The following graph depicts demand.
Q54: If the absolute value of the slope
Q55: The following graph depicts demand.
Q58: Suppose you learn that in 1,900, households
Unlock this Answer For Free Now!
View this answer and more for free by performing one of the following actions

Scan the QR code to install the App and get 2 free unlocks

Unlock quizzes for free by uploading documents