This graph shows the marginal cost and marginal benefit associated with roadside litter clean up. Assume that the marginal benefit curve and marginal cost curve each have their usual slope. 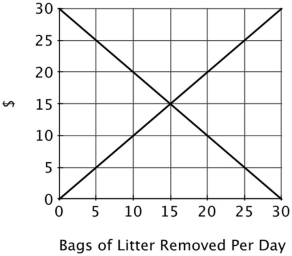 From the graph, one can infer that:
A) the marginal benefit of picking up the 10th bag of litter exceed the marginal cost.
B) the marginal cost of picking up the 10th bag of litter exceed the marginal benefit.
C) the marginal benefit of picking up the 20th bag of litter exceed the marginal cost.
D) the total benefit of having 30 bags removed is zero.
Correct Answer:
Verified
Q70: If the marginal cost of reducing pollution
Q73: Refer to the figure below. This graph
Q76: Refer to the figure below. In this
Q79: This graph shows the marginal cost and
Q81: Refer to the figure below. The deadweight
Q100: Which of the following would be most
Q101: The essential reason some species of whales
Q104: Early settlers in the town of Dry
Q107: Early settlers in the town of Dry
Q115: Total economic surplus will be _ in
Unlock this Answer For Free Now!
View this answer and more for free by performing one of the following actions

Scan the QR code to install the App and get 2 free unlocks

Unlock quizzes for free by uploading documents