Refer to the figure below. This graph describes a good that: 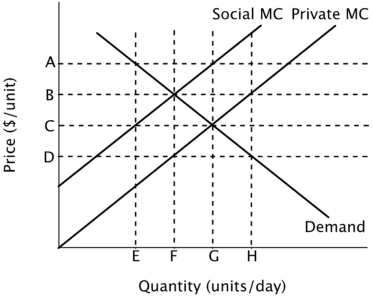
A) generates positive externalities.
B) should be banned.
C) generates negative externalities.
D) the government should subsidize.
Correct Answer:
Verified
Q87: A village has five residents, each
Q88: A village has five residents, each
Q90: The following data show the relationship
Q93: A village has five residents, each
Q94: A village has five residents, each
Q95: A village has five residents, each
Q96: In order to achieve a socially optimal
Q97: The following data show the relationship
Q103: If it is possible to place a
Q113: Early settlers in the town of Dry
Unlock this Answer For Free Now!
View this answer and more for free by performing one of the following actions

Scan the QR code to install the App and get 2 free unlocks

Unlock quizzes for free by uploading documents