Refer to the figure below. This graph describes a good that: 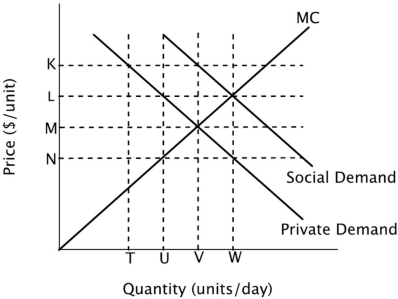
A) generates positive externalities.
B) should be banned.
C) generates negative externalities.
D) the government should tax.
Correct Answer:
Verified
Q97: The following data show the relationship
Q99: In order to achieve a socially optimal
Q100: Refer to the figure below. Private markets
Q101: Refer to the figure below. At the
Q103: Suppose that in most car collisions between
Q104: Refer to the figure below. The socially
Q106: Refer to the figure below. The socially
Q119: Which of the following is most likely
Q124: Suppose that in most car collisions between
Q138: The town of Pleasantville has two local
Unlock this Answer For Free Now!
View this answer and more for free by performing one of the following actions

Scan the QR code to install the App and get 2 free unlocks

Unlock quizzes for free by uploading documents