The figure shows a normal N(400, 23) distribution. Find the x value for the shaded area. 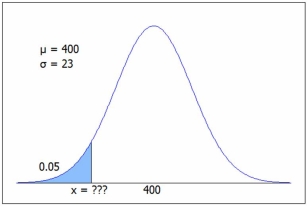 C.2 we get P(z < -1.645) = .05, so x = µ + zσ = 400 - 1.645(23) = 362.2, or from Excel =NORM.INV(0.05,400,23) = 362.2.
A) 379.1
B) 362.2
C) 355.7
D) 347.6
Correct Answer:
Verified
Q96: A multiple choice exam has 100 questions.
Q97: If arrivals follow a Poisson distribution with
Q98: Excel's =RAND() function produces random numbers that
Q99: For Gardyloo Manufacturing, the true proportion of
Q100: Compared to the area between z =
Q102: If the mean waiting time for the
Q103: The ages of job applicants for a
Q104: The triangular distribution T(10, 20, 50) has
Q105: The figure shows a standard normal N(0,
Q106: The figure shows a standard normal N(0,
Unlock this Answer For Free Now!
View this answer and more for free by performing one of the following actions

Scan the QR code to install the App and get 2 free unlocks

Unlock quizzes for free by uploading documents