The graph below shows the Chamberlin model. The profit-maximizing price is at 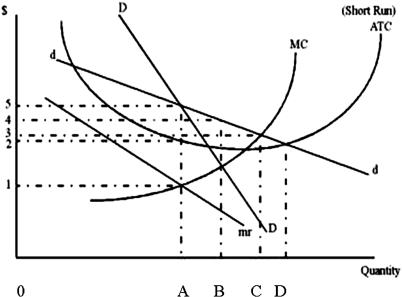
A) 02.
B) 03.
C) 04.
D) 05.
Correct Answer:
Verified
Q22: The graph below shows the Chamberlin model.
Q23: Suppose that firms are located in a
Q24: Suppose that firms are located in
Q25: The demand curve shown below has four
Q26: Which of the following is an application
Q28: Suppose that firms are located in a
Q29: The graph below shows the Chamberlin model.
Q30: If a monopolistically competitive firm is making
Q31: Suppose there are two firms in a
Q32: The graph below shows the Chamberlin model.
Unlock this Answer For Free Now!
View this answer and more for free by performing one of the following actions

Scan the QR code to install the App and get 2 free unlocks

Unlock quizzes for free by uploading documents