Refer to the graph below. Assume the consumer has an income of $100, the price of X is $2 and the price of Y is $1. According to the graph, the income effect of a decrease in the price of X from $2 to $1 is equal to: 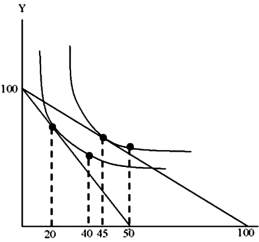
A) 5
B) 30
C) 20
D) 25
Correct Answer:
Verified
Q36: In the graph below, as the consumer
Q37: Your income rises from $1,000 a year
Q38: Say the demand curve for cigarettes was
Q39: The cross-price elasticity of demand for complements
Q40: The income elasticity of demand for an
Q42: From the graph given, locate two points
Q43: What is the cross-price elasticity between beef
Q44: On the graph below sketch the income
Q45: Which statement is definitely true about shelter
Q46: If there are no costs in selling
Unlock this Answer For Free Now!
View this answer and more for free by performing one of the following actions

Scan the QR code to install the App and get 2 free unlocks

Unlock quizzes for free by uploading documents