The figure shows the graph of vx versus time for an object moving along the x-axis.Solve graphically for the distance traveled between t = 5.0 s and t = 9.0 s. 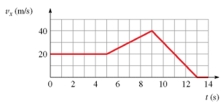
A) 110 m
B) 120 m
C) 100 m
D) 130 m
Correct Answer:
Verified
Q1: Two masses are being pulled up a
Q2: Two masses are connected by a string
Q3: Two masses are connected by a string
Q5: Two masses are being pulled up a
Q6: Two masses are being pulled up a
Q7: Two masses are connected by a string
Q8: Two masses are being pulled up a
Q9: Two masses are connected by a string
Q10: The figure shows the graph of vx
Q11: Two masses are being pulled up a
Unlock this Answer For Free Now!
View this answer and more for free by performing one of the following actions

Scan the QR code to install the App and get 2 free unlocks

Unlock quizzes for free by uploading documents