The graph shows the speedometer reading of a car as it comes to a stop along a straight-line path.How far does the car move between t = 0 s and t = 16 s? 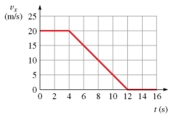
A) 130 m
B) 140 m
C) 150 m
D) 160 m
Correct Answer:
Verified
Q11: A car travels a distance of 100
Q13: The figure is a graph of an
Q14: The figure is a graph of vx(t)for
Q15: The figure is a graph of the
Q16: Which of the following specifications would allow
Q19: The graph shows vx versus t for
Q20: Displacement is
A) the distance traveled from the
Q21: A tractor T is pulling a trailer
Q22: A tractor of mass M1 = 2,000
Q54: You drive five blocks due north, five
Unlock this Answer For Free Now!
View this answer and more for free by performing one of the following actions

Scan the QR code to install the App and get 2 free unlocks

Unlock quizzes for free by uploading documents