The figure shows the graph of vx versus time for an object moving along the x-axis.Solve graphically for the distance traveled from t = 9.0 s to t = 13.0 s. 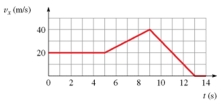
A) 60 m
B) 84 m
C) 76 m
D) 80 m
Correct Answer:
Verified
Q6: If an object is located 20 m
Q6: The graph shows vx versus t for
Q7: A displacement vector D is given as
Q8: A displacement vector D is given as
Q12: If an object is located 20 m
Q13: The figure is a graph of an
Q14: The figure is a graph of vx(t)for
Q15: The figure is a graph of the
Q16: Which of the following specifications would allow
Q54: You drive five blocks due north, five
Unlock this Answer For Free Now!
View this answer and more for free by performing one of the following actions

Scan the QR code to install the App and get 2 free unlocks

Unlock quizzes for free by uploading documents