Multiple Choice
Figure 18-1
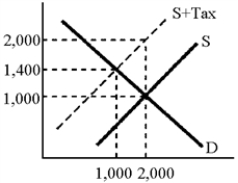
-According to the graph in Figure 18-1, the increase in the amount that consumers pay as a result of the tax is
A) 1000
B) 600
C) 400
D) indeterminate
Correct Answer:
Verified
Related Questions
Q163: Figure 18-1 Q164: Figure 18-2 Q169: In the spring of 1993, President Clinton Q170: Figure 18-2 Q171: Which of the following taxes is least Unlock this Answer For Free Now! View this answer and more for free by performing one of the following actions Scan the QR code to install the App and get 2 free unlocks Unlock quizzes for free by uploading documents![]()
![]()
![]()

