Multiple Choice
Figure 20-1 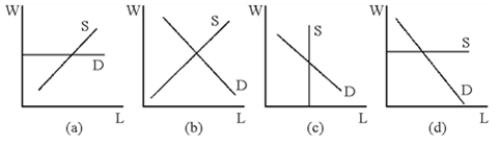
-Which of the diagrams in Figure 20-1 shows the situation of an individual firm that hires labor in a perfectly competitive market?
A) A
B) B
C) C
D) D
Correct Answer:
Verified
Related Questions
Q22: The supply curve of truck drivers is
Q121: Income effect of lowering wages implies
A)workers prefer
Q122: Which of the following observations concerning labor
Q123: The substitution effect from a change in
Q125: The impact of an increase in oil
Q127: Over the last century,
A)hours worked have increased
Q128: Which of the following would not be
Unlock this Answer For Free Now!
View this answer and more for free by performing one of the following actions

Scan the QR code to install the App and get 2 free unlocks

Unlock quizzes for free by uploading documents