Multiple Choice
Figure 22-3
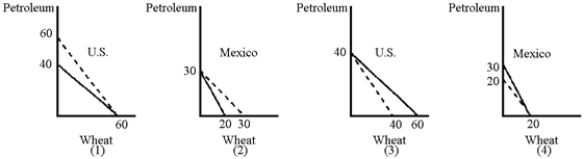
-In Figure 22-3, the solid lines represent the respective production possibilities curves for the United States and Mexico.Which graphs show the correct consumption possibilities curves (dashed lines) after an agreement is reached to trade 1 unit of wheat for 1 unit of petroleum?
A) (1) and (4)
B) (1) and (2)
C) (2) and (3)
D) (3) and (4)
Correct Answer:
Verified
Related Questions
Q83: A country has an absolute advantage over
Q85: Are there impediments to international movement of
Q88: David Ricardo discovered that two countries can

