Multiple Choice
Figure 22-5
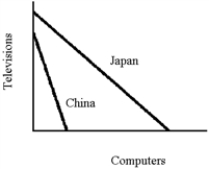
-From the graph in Figure 22-5 (curves show output per unit of labor input) , one can infer that
A) in terms of TVs, computers are more expensive in China than Japan.
B) in terms of computers, TVs are more expensive in China than Japan.
C) China should produce more TVs and fewer computers.
D) All of the above are correct.
Correct Answer:
Verified
Related Questions
Q11: Is it possible for a country to
Q101: If two countries each are currently producing
Q106: What would be the output combination for

