Consider the graph of a call option shown at right. The option is a three-month American call option on €62,500 with a strike price of $1.50 = €1.00 and an option premium of $3,125. What are the values of A, B, and C, respectively? 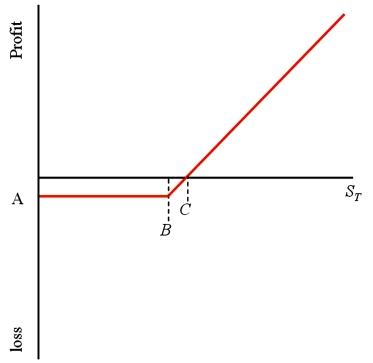
A) A = -$3,125 (or -$.05 depending on your scale) ; B = $1.50; C = $1.55
B) A = -€3,750 (or -€.06 depending on your scale) ; B = $1.50; C = $1.55
C) A = -$.05; B = $1.55; C = $1.60
D) none of the above
Correct Answer:
Verified
Q1: Yesterday,you entered into a futures contract to
Q16: Yesterday, you entered into a futures contract
Q18: In the event of a default on
Q19: Three days ago, you entered into a
Q20: Today's settlement price on a Chicago Mercantile
Q22: Which of the lines is a graph
Q24: The current spot exchange rate is $1.55
Q25: If you think that the dollar is
Q26: With currency futures options the underlying asset
Q39: An "option" is
A)a contract giving the seller
Unlock this Answer For Free Now!
View this answer and more for free by performing one of the following actions

Scan the QR code to install the App and get 2 free unlocks

Unlock quizzes for free by uploading documents