Figure 2 depicts the 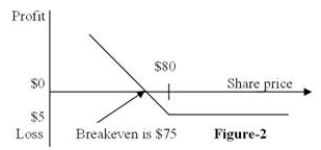
A) position diagram for the buyer of a call option.
B) profit diagram for the buyer of a call option.
C) position diagram for the buyer of a put option.
D) profit diagram for the buyer of a put option.
Correct Answer:
Verified
Q3: In June 2017, an investor buys call
Q5: In June 2017, an investor buys a
Q5: The buyer of a call option has
Q6: The two principal options exchanges in the
Q7: An option that can be exercised any
Q9: From a geometric viewpoint, how is the
Q10: Figure 3 depicts the Q11: Figure 4 depicts the Q12: The value of a put option at Q17: The owner of a regular exchange-listed call-option![]()
![]()
Unlock this Answer For Free Now!
View this answer and more for free by performing one of the following actions

Scan the QR code to install the App and get 2 free unlocks

Unlock quizzes for free by uploading documents