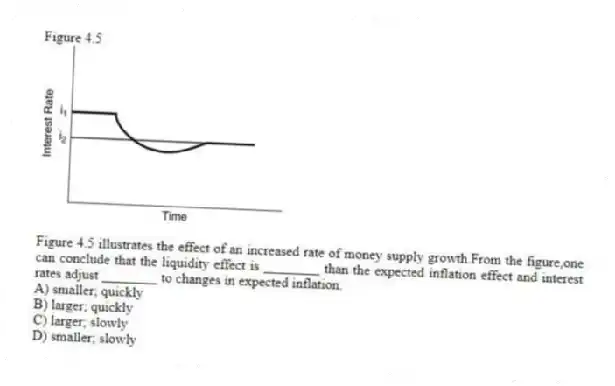
Figure 4.5
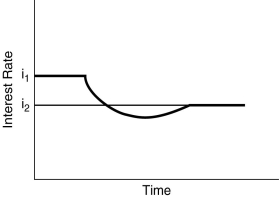
-Figure 4.5 illustrates the effect of an increased rate of money supply growth.From the figure,one can conclude that the liquidity effect is ________ than the expected inflation effect and interest rates adjust ________ to changes in expected inflation.
A) smaller; quickly
B) larger; quickly
C) larger; slowly
D) smaller; slowly
Correct Answer:
Verified
Q69: If the liquidity effect is smaller than
Q70: When the growth rate of the money
Q71: A decline in the price level causes
Q72: Holding everything else constant,a decrease in the
Q73: A rise in the price level causes
Q75: Figure 4.3 Q77: A higher level of income causes the Q78: A decline in the expected inflation rate Q79: Figure 4.3 Q126: When the growth rate of the money
![]()
![]()
Unlock this Answer For Free Now!
View this answer and more for free by performing one of the following actions

Scan the QR code to install the App and get 2 free unlocks

Unlock quizzes for free by uploading documents