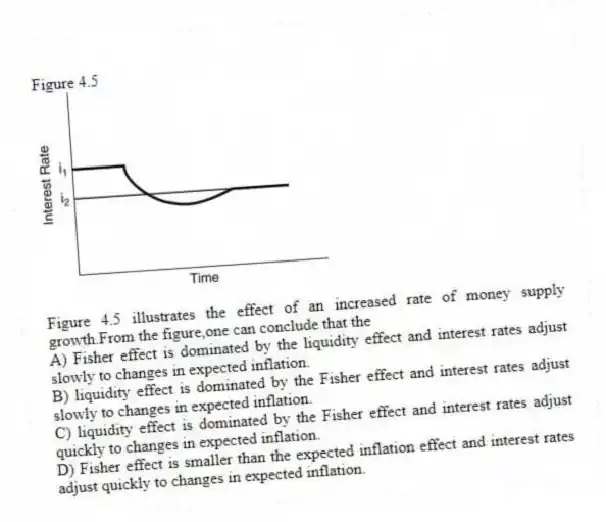
Figure 4.5
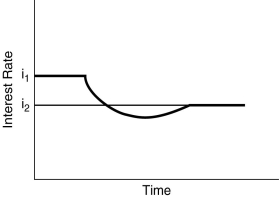
-Figure 4.5 illustrates the effect of an increased rate of money supply growth.From the figure,one can conclude that the
A) Fisher effect is dominated by the liquidity effect and interest rates adjust slowly to changes in expected inflation.
B) liquidity effect is dominated by the Fisher effect and interest rates adjust slowly to changes in expected inflation.
C) liquidity effect is dominated by the Fisher effect and interest rates adjust quickly to changes in expected inflation.
D) Fisher effect is smaller than the expected inflation effect and interest rates adjust quickly to changes in expected inflation.
Correct Answer:
Verified
Q61: Milton Friedman contends that it is entirely
Q62: Figure 4.3 Q63: Holding everything else constant,an increase in the Q64: When the growth rate of the money Q65: When the growth rate of the money Q67: If the Fed wants to permanently lower Q68: A lower level of income causes the Q69: If the liquidity effect is smaller than Q70: When the growth rate of the money Q71: A decline in the price level causes
![]()
Unlock this Answer For Free Now!
View this answer and more for free by performing one of the following actions

Scan the QR code to install the App and get 2 free unlocks

Unlock quizzes for free by uploading documents