The following chart depicts 16 sample means that were taken at periodic intervals and plotted on a control chart. Does the output appear to be random? 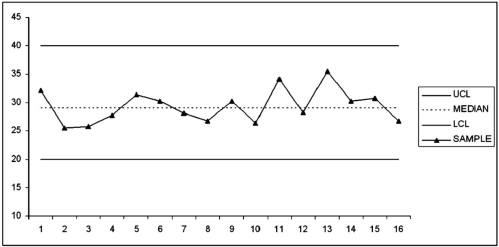
Correct Answer:
Verified
View Answer
Unlock this answer now
Get Access to more Verified Answers free of charge
Q101: Construct the appropriate two-sigma control chart
Q102: The specification limit for a product is
Q104: Organizations should work to improve process capability
Q105: Studies on a bottle-filling machine indicate that
Q107: The specifications for a product are 6
Q107: A quality analyst wants to construct
Q108: Four samples of three observations each
Q109: When a process is in control, it
Q110: Perform run tests on the given
Q111: Given the following control chart, would you
Unlock this Answer For Free Now!
View this answer and more for free by performing one of the following actions

Scan the QR code to install the App and get 2 free unlocks

Unlock quizzes for free by uploading documents