In the following figure,the uncontrolled level of emissions is _______. 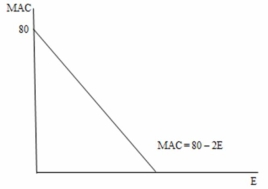
A) 80
B) 40
C) 160
D) impossible to determine from the information provided
Correct Answer:
Verified
Q5: Under what circumstances would a firm with
Q5: In the following figure,the marginal abatement cost
Q7: Describing and explaining economic events that have
Q8: In the following figure,the total abatement cost
Q8: For certain pollutants with a (n) _,
Q9: The study of what ought to be
Q9: A(n) _ shows how damages are related
Q12: For a marginal damage cost function equal
Q13: Suppose there are three polluting sources with
Q14: In the following figure,the marginal damage cost
Unlock this Answer For Free Now!
View this answer and more for free by performing one of the following actions

Scan the QR code to install the App and get 2 free unlocks

Unlock quizzes for free by uploading documents