The utility curve given below represents the preferences of a _________________ decision maker. 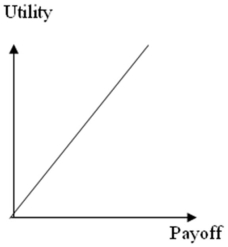
A) Risk averse
B) Risk neutral
C) Risk seeking
D) None of these
Correct Answer:
Verified
Q28: The utility curve given below represents the
Q29: The _ is the difference between the
Q30: The utility curve given below represents the
Q31: In utility analysis,a utility curve that shows
Q32: The expected net gain of sampling equals
Q34: A person's utility is determined by the
Q35: When we assess the worth of sample
Q36: Alternatives 1 and 2 in the
Q37: Alternatives 1 and 2 in the
Q38: Alternatives 1 and 2 in the
Unlock this Answer For Free Now!
View this answer and more for free by performing one of the following actions

Scan the QR code to install the App and get 2 free unlocks

Unlock quizzes for free by uploading documents