This graph illustrates the market for groceries with and without a per unit tax: 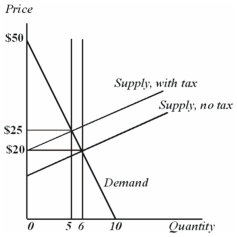
A sales tax on groceries of $2.00 per unit would increase the equilibrium total price by
A) more than $2.00 but less than $4.00.
B) exactly $2.00.
C) less than $2.00 but more than $1.00.
D) exactly $1.00.
Correct Answer:
Verified
Q117: The state of New Porkswick is one
Q118: The judicial system is an example of
Q119: The state of New Porkswick is one
Q120: The combination of pork barrel spending and
Q121: One reason that some people oppose the
Q123: Pat and Chris are vying for Jordan's
Q124: Suppose the federal government must turn to
Q125: The city of Dustin is going to
Q126: Pat and Chris are vying for Jordan's
Q127: The city of Dustin is going to
Unlock this Answer For Free Now!
View this answer and more for free by performing one of the following actions

Scan the QR code to install the App and get 2 free unlocks

Unlock quizzes for free by uploading documents