The following graph illustrates a low wage labor market. 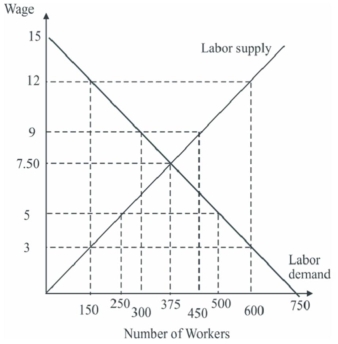
In an unregulated competitive market,the equilibrium wage rate would be __________ and the equilibrium employment level would be __________.
A) $12.00;600
B) $9.00;300
C) $7.50;375
D) $5.00;250
Correct Answer:
Verified
Q131: Leo is a welfare recipient who qualifies
Q132: Leo is a welfare recipient who qualifies
Q133: Arguments against programs that tax income to
Q134: The level of income the federal government
Q135: Suppose the elasticity of labor demand is
Q137: A minimum wage law prohibits employers from
Q138: Imposing a minimum wage in the labor
Q139: There are two separate labor markets in
Q140: The following graph illustrates a low wage
Q141: Unlike the minimum wage,the Earned Income Tax
Unlock this Answer For Free Now!
View this answer and more for free by performing one of the following actions

Scan the QR code to install the App and get 2 free unlocks

Unlock quizzes for free by uploading documents