This graph shows one consumer's demand for ice cream at the student union: 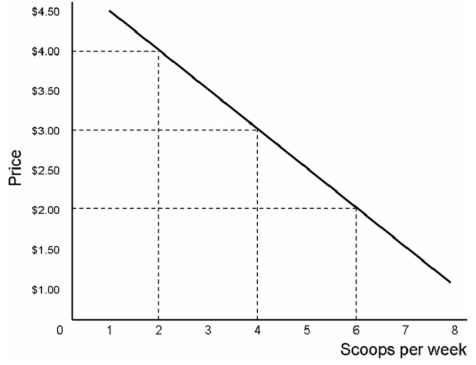
During the summer,there are only 300 ice cream consuming students on campus,each with demand as shown above.At $2.00 per scoop,those 300 students purchase ____ scoops of ice cream per week.
A) 1,200
B) 1,500
C) 1,800
D) 3,000
Correct Answer:
Verified
Q90: Why do lines tend to be longer
Q91: This graph shows one consumer's demand for
Q92: Fran runs a doughnut shop in
Q93: This graph shows one consumer's demand for
Q94: This table shows demand for shoes
Q96: This table shows demand for shoes
Q97: Suppose you are a government analyst,and you
Q98: This graph shows one consumer's demand for
Q99: According to the textbook,the homes of the
Q100: This graph shows one consumer's demand for
Unlock this Answer For Free Now!
View this answer and more for free by performing one of the following actions

Scan the QR code to install the App and get 2 free unlocks

Unlock quizzes for free by uploading documents