The following graph depicts demand. 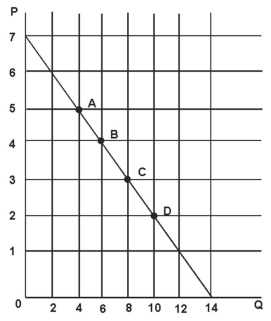
Refer to the figure above.The price elasticity of demand at point D is:
A) 5/2.
B) 1/2.
C) 2/5.
D) 2.
Correct Answer:
Verified
Q42: If the elasticity of demand for the
Q43: If the slope of the demand curve
Q44: The following graph depicts demand. 
Q45: The following graph depicts demand.
Q46: Economists have found that the price elasticity
Q48: The following graph depicts demand.
Q49: Suppose two demand curves have a point
Q50: Suppose that the short run price elasticity
Q51: Price elasticity of demand is _ the
Q52: The following graph depicts demand.
Unlock this Answer For Free Now!
View this answer and more for free by performing one of the following actions

Scan the QR code to install the App and get 2 free unlocks

Unlock quizzes for free by uploading documents