The following graph illustrates a low wage labor market. 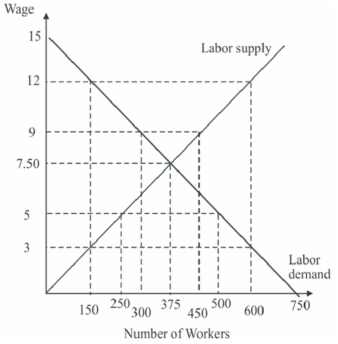
Suppose a minimum wage of $12 is imposed in this labor market to improve the wages of low wage workers.This results in
A) 225 workers losing their jobs.
B) 375 workers receiving $12 an hour.
C) an improvement in the economic status of the original 375 workers.
D) a new equilibrium at $12 and 150 workers.
Correct Answer:
Verified
Q123: Leo is a welfare recipient who qualifies
Q125: Leo is a welfare recipient who qualifies
Q129: There are two separate labor markets in
Q130: Leo is a welfare recipient who qualifies
Q132: The following graph illustrates a low wage
Q133: Arguments against programs that tax income to
Q134: The level of income the federal government
Q135: Suppose the elasticity of labor demand is
Q138: Imposing a minimum wage in the labor
Q139: There are two separate labor markets in
Unlock this Answer For Free Now!
View this answer and more for free by performing one of the following actions

Scan the QR code to install the App and get 2 free unlocks

Unlock quizzes for free by uploading documents