This graph shows the marginal costs and marginal benefits associated with roadside litter clean up.Assume that the marginal cost and marginal benefit curves slope in the usual directions. 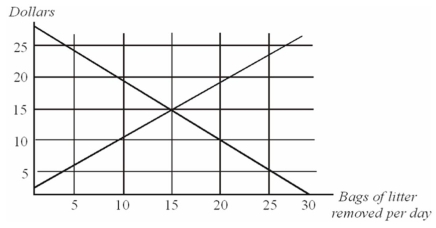
Refer to the information given above.The socially optimal number of bags of litter removed from the roadside is:
A) 10.
B) 15.
C) 20.
D) 30.
Correct Answer:
Verified
Q42: Suppose Erie Textiles can dispose of
Q44: Suppose Erie Textiles can dispose of
Q45: Suppose Erie Textiles can dispose of
Q48: Suppose Erie Textiles can dispose of
Q50: Suppose that the EPA has proposed strict
Q51: Suppose Erie Textiles can dispose of
Q53: If the marginal cost of reducing pollution
Q54: Suppose that the EPA has proposed strict
Q62: A policy maker has argued for higher
Q66: Which one of the following government actions
Unlock this Answer For Free Now!
View this answer and more for free by performing one of the following actions

Scan the QR code to install the App and get 2 free unlocks

Unlock quizzes for free by uploading documents