This graph shows one consumer's demand for ice cream at the student union: 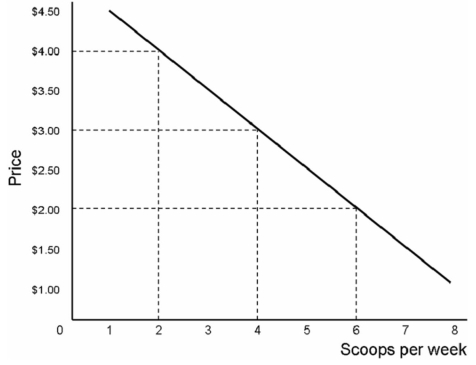
During a regular semester,there are 500 students.Each student's demand for ice cream is as depicted above.When the price of one scoop of ice cream is $2.00,those 500 students purchase a total of
A) 2,000 scoops of ice cream
B) 2,500 scoops of ice cream
C) 3,000 scoops of ice cream
D) 5,000 scoops of ice cream
Correct Answer:
Verified
Q82: This graph shows one consumer's demand for
Q83: This graph shows one consumer's demand for
Q84: This graph shows one consumer's demand for
Q84: The absolute price of a good in
Q88: The fact that the average price of
Q88: This table shows demand for shoes
Q89: This graph shows one consumer's demand for
Q90: Fran runs a doughnut shop in
Q91: This table shows demand for shoes
Q97: Suppose you are a government analyst,and you
Unlock this Answer For Free Now!
View this answer and more for free by performing one of the following actions

Scan the QR code to install the App and get 2 free unlocks

Unlock quizzes for free by uploading documents