This graph describes the production possibilities on the island of Genovia: 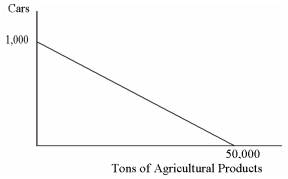
The opportunity cost of producing one car in Genovia is:
A) 5,000 tons of agricultural products.
B) 500 tons of agricultural products.
C) 5 tons of agricultural products.
D) 50 tons of agricultural products.
Correct Answer:
Verified
Q2: Which of the following is true?
A) Lou
Q21: The slope of any production possibilities curve
Q24: The production possibilities curve is:
A) the boundary
Q27: Any combination of goods that can be
Q27: This graph describes the production possibilities on
Q32: The United States has a comparative advantage
Q33: If a producer is operating at an
Q34: Ginger and Maryann are lost in the
Q37: The United States generally has a comparative
Q55: The textbook notes that the last time
Unlock this Answer For Free Now!
View this answer and more for free by performing one of the following actions

Scan the QR code to install the App and get 2 free unlocks

Unlock quizzes for free by uploading documents