In the diagrams below, the subscript "1" refers to the initial position of the curve, while the subscript "2" refers to the final position after the curve shifts. 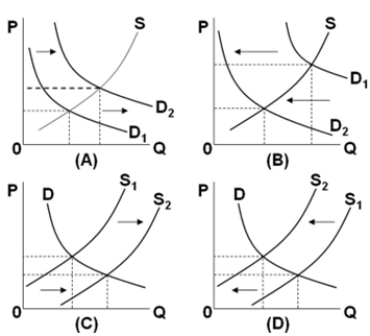 Which diagram illustrates the effects on the peanut butter market, if severe flooding destroys a large portion of the peanut crop in the economy?
A) A
B) B
C) C
D) D
Correct Answer:
Verified
Q256: Which of the following statements is correct?
Q263: Assume that the graphs show a competitive
Q264: The following data show the supply and
Q266: A government-set price floor on a product
A)
Q297: The market system automatically corrects a surplus
Q306: A decrease in supply, holding demand constant,
Q307: A headline reads, "Lumber Prices Up Sharply."
Q315: A television station reports that the price
Q331: An increase in demand for oil along
Q336: A decrease in demand and an increase
Unlock this Answer For Free Now!
View this answer and more for free by performing one of the following actions

Scan the QR code to install the App and get 2 free unlocks

Unlock quizzes for free by uploading documents