Assume that the graphs show a competitive market for the product stated in the question. 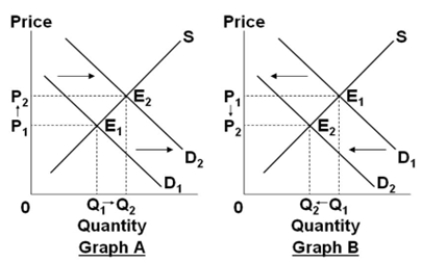
 Select the graph above that best shows the change in the market for gasoline, when the price of oil, which is used to produce gasoline, increases because of reduced production by major oil-producing nations.
A) Graph A
B) Graph B
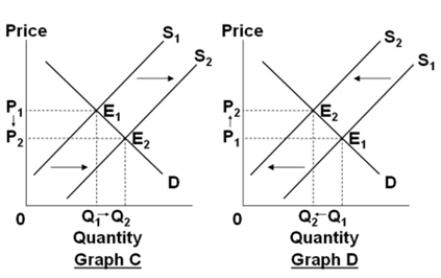
C) Graph C
D) Graph D
Correct Answer:
Verified
Q1: Buyers and sellers do not have to
Q18: The law of demand states that if
Q26: An effective price ceiling will lower the
Q28: An increase in both supply and demand
Q32: If we observe that the price of
Q34: If the government subsidizes the car makers
Q53: In response to the general public's complaints
Q306: Assume that the graphs show a competitive
Q307: A television station reports that the price
Q309: In the dollar-euro foreign exchange market, if
Unlock this Answer For Free Now!
View this answer and more for free by performing one of the following actions

Scan the QR code to install the App and get 2 free unlocks

Unlock quizzes for free by uploading documents