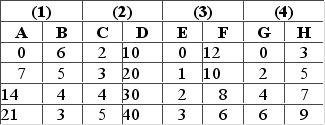
The question below is based on the following four sets of data-pairs: (1) A and B, (2) C and D, (3) E and F, and (4) G and H. In each set, the independent variable is in the left column and the dependent variable is in the right column.  The slope of the linear graph that pictures data set 2 above is
A) .10.
B) 20.
C) 5.
D) 10.
Correct Answer:
Verified
Q357: The budget line shows the various incomes
Q358: The resource category called "land" includes forests,
Q359: The economizing problem for individuals arises from
Q360: "The role of government in the economy
Q361: A nation's production possibilities curve shows the
Q363: If A decreases, then B will also
Q364: An increase in immigration would shift the
Q365: 460. In a relationship between two variables,
Q366: A reduction in the unemployment rate will
Q367: The slope of a graph with "income"
Unlock this Answer For Free Now!
View this answer and more for free by performing one of the following actions

Scan the QR code to install the App and get 2 free unlocks

Unlock quizzes for free by uploading documents